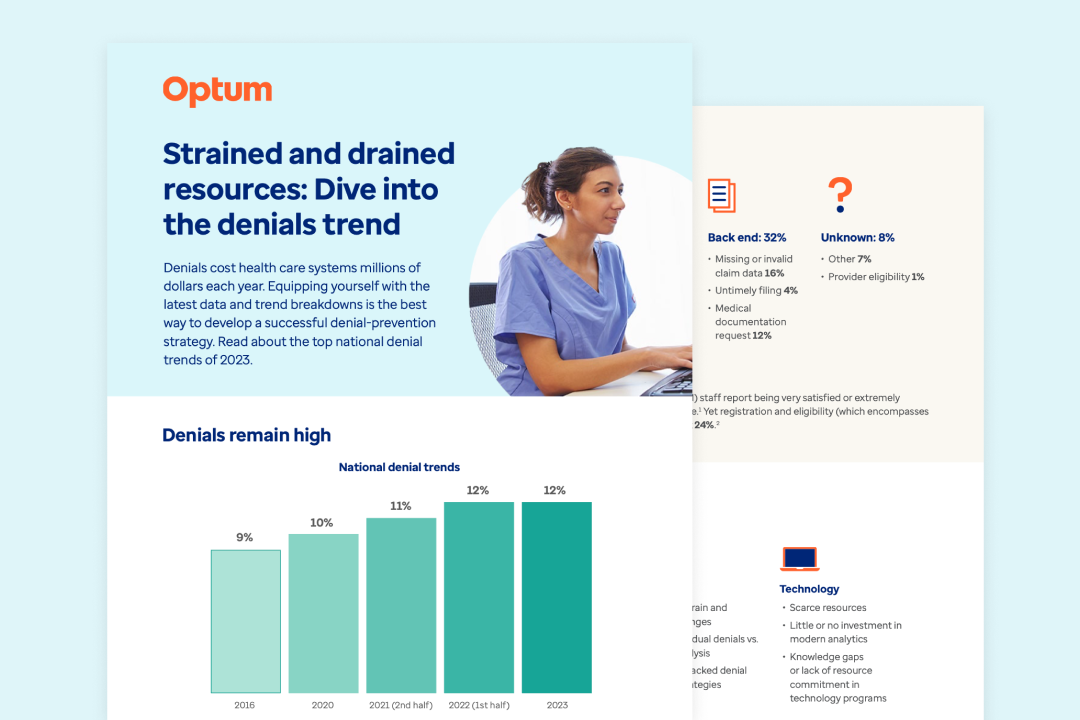
A recent study1 of more than 124 million medical claims from more than 1,400 hospitals nationwide found that claim denials are still increasing, with 84% being potentially avoidable.
Our 2024 trend infographic offers insights to national claim denials trends, such as:
- Trends through the front, back and middle revenue cycle
- Why and where errors occur in claim denials
- Breakdowns of avoidable and recoverable denials
Complete the form to download the infographic.
- The Optum 2024 Revenue Cycle Denials Index is an internal analysis of approximately 124 million hospital claim remits valued at $500 billion in total charges across more than 1,400 U.S. hospitals.


